Create flat violin plot with ggplot2 with geom_flat_violin. Shamelessly copy-pasted from Ben Marwick.
geom_flat_violin(
  mapping = NULL,
  data = NULL,
  stat = "ydensity",
  position = "dodge",
  trim = TRUE,
  scale = "area",
  show.legend = NA,
  inherit.aes = TRUE,
  ...
)
Arguments
| mapping | A value |
|---|---|
| data | A value |
| stat | A value |
| position | A value |
| trim | A value |
| scale | A value |
| show.legend | A value |
| inherit.aes | A value |
| ... | A value |
Examples
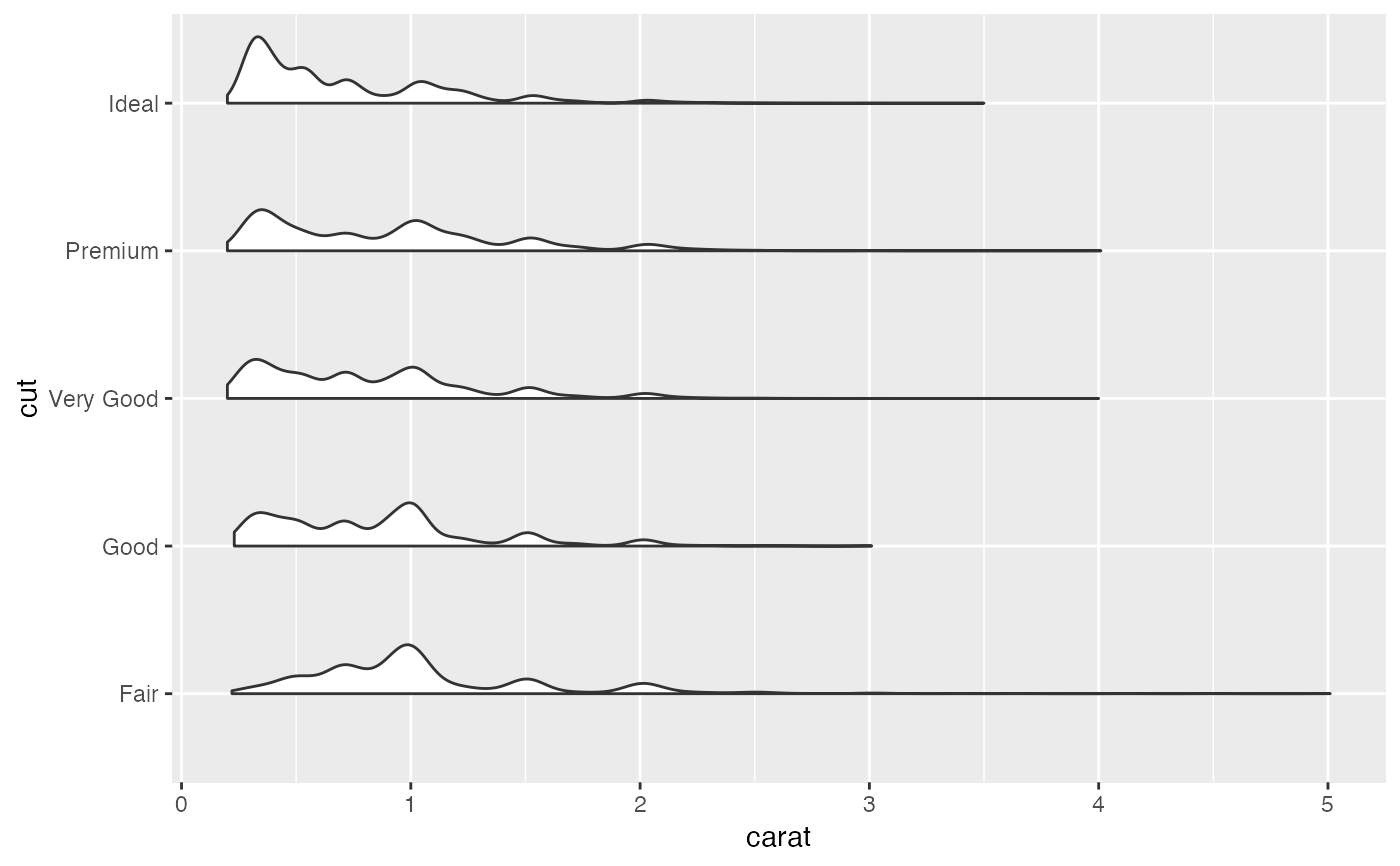
ggplot2::ggplot(ggplot2::diamonds, ggplot2::aes(cut, carat)) +
 ggplot2::coord_flip() +
 geom_flat_violin()